Data Engineering
Stock markets hate uncertainty, so we wanted to measure how much conflicts impact them, which can give an idea of the global economy.
Data
To analyze geopolitical tensions and the regional and international economy, we first had to find relevant data sources. After looking for data sources that fit our constraints (mostly pricing, data availability, and information quality), we decided to focus on two main sources:
- Yahoo Finance API, through the yfinance Python package.
- Uppsala Conflict Data Project (UCDP), from their download center
From these sources, we extract the following data:
- Yahoo Finance
- Indices
- Futures
- Forex
- Cryptocurrency
- UCDP
- Yearly armed conflicts
- Actors
- Georeferenced events
Architecture
Now that we have the data sources, we need a project architecture.
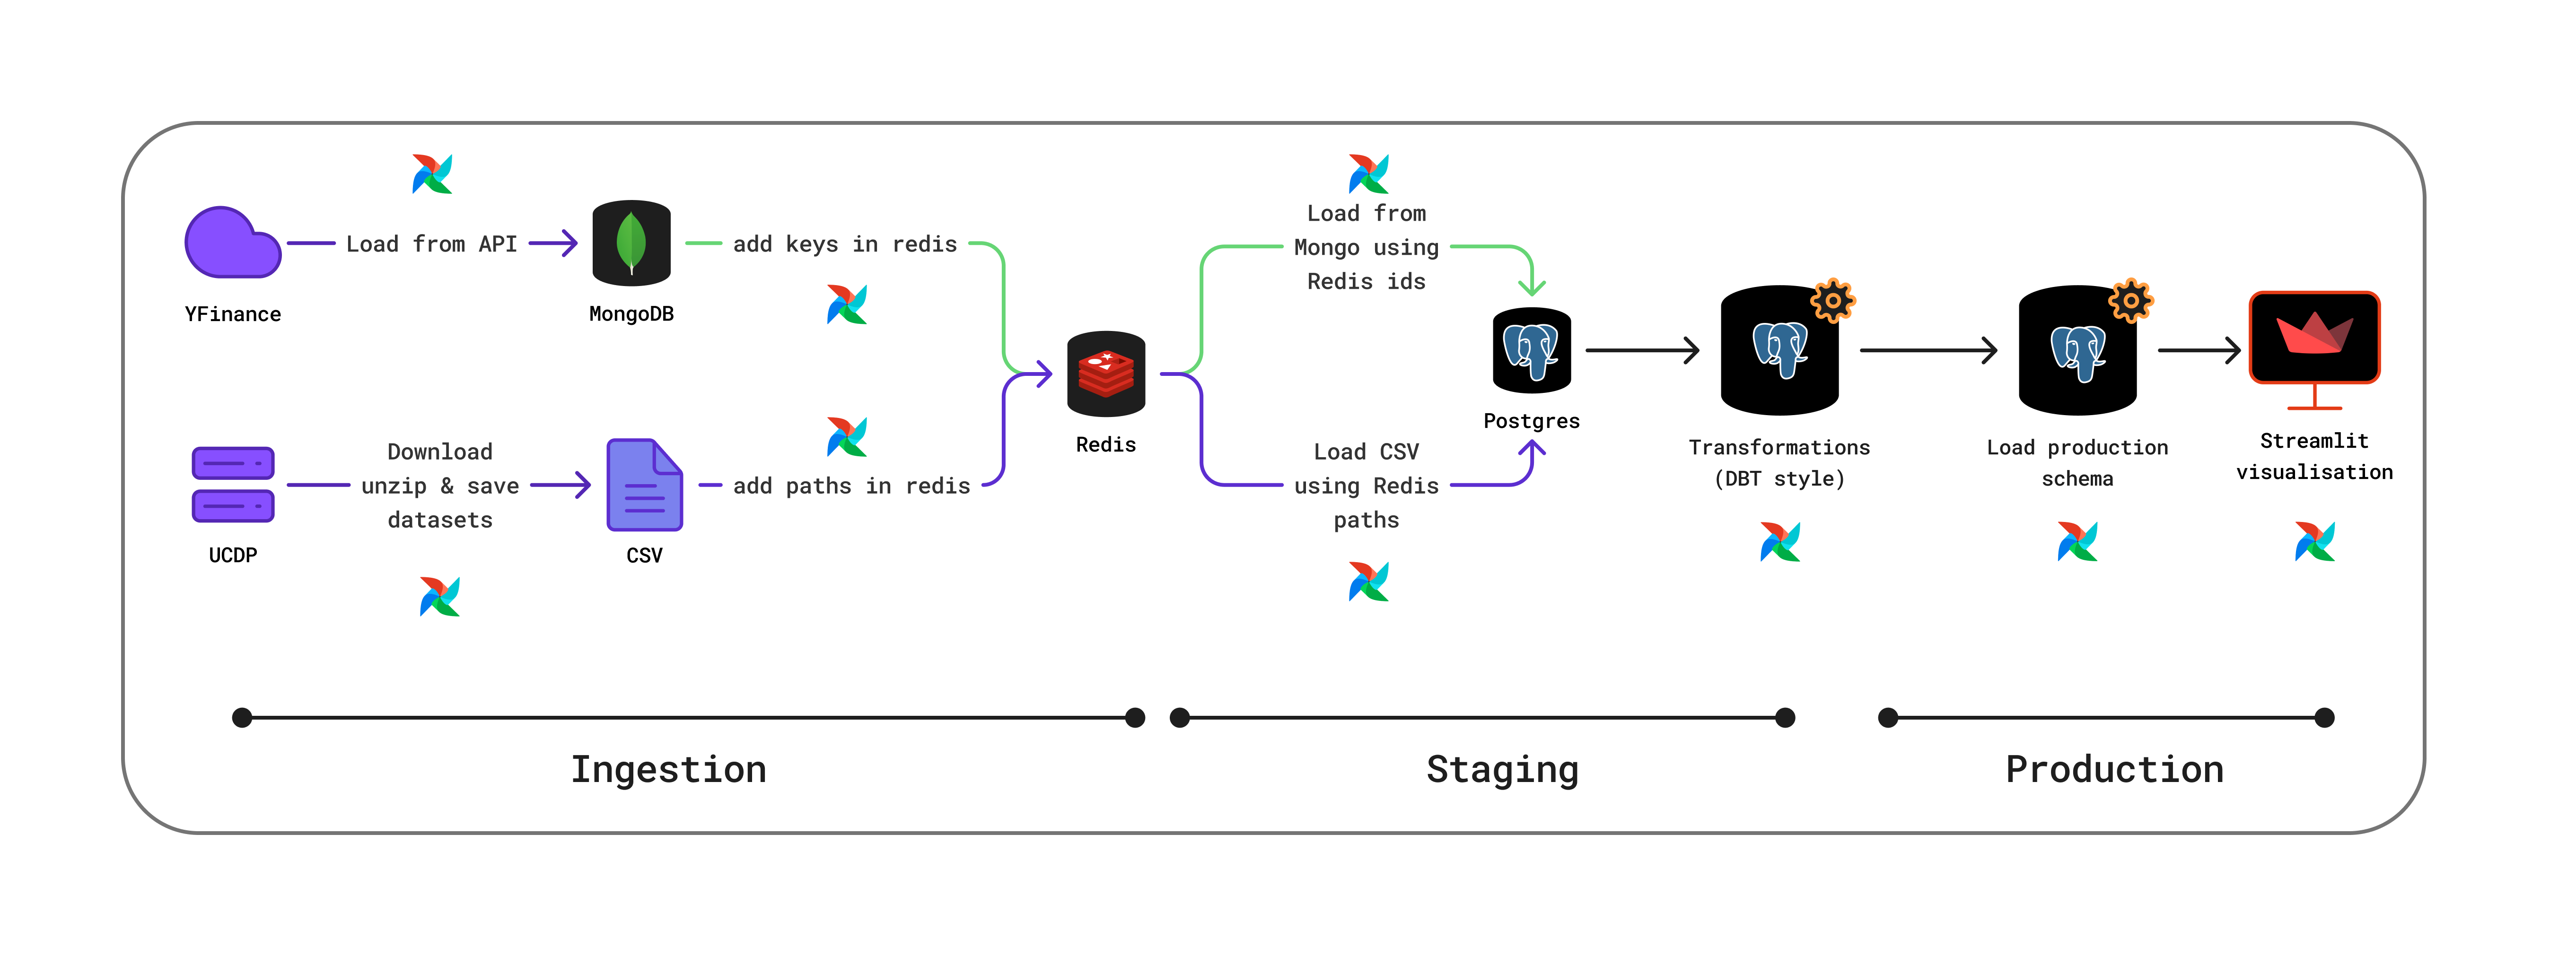
This diagram represents the data flow of our project. First, we acquire raw information through the yfinance Python API and by downloading the necessary UCDP datasets. The ingestion pipeline stores the yfinance data in MongoDB and the UCDP datasets as CSV files.
We load metadata into Redis to prepare the transition from MongoDB to PostgreSQL, which is the database we use to perform our staging operations. All data transformation and cleaning are done with SQL queries (in a similar way to how dbt operates), orchestrated with Airflow’s SQLOperator.
Once our PostgreSQL transformations are run, we transfer the data to another PostgreSQL database: the clean database.
The purpose of the clean database is to model the data so that it is easy to query for our objectives.
Once this process is done, our Streamlit visualization can be easily updated. Streamlit is used to present the queries we wanted to perform by building this full pipeline.
If you are curious about the implementation or a more detailed explanation of the project, you can take a look at our repository.
This project was developed during the Data Engineering course at INSA Lyon.